Tabular models and the Data Analysis Expression (DAX) language offer Microsoft Power BI users enormous analytic and visualization capabilities. As powerful as these tools are, when using them, it can feel like one is reinventing the wheel to solve basic problems that have long-accepted Business Intelligence (BI) solutions. If you find yourself hand-writing DAX code to simulate compound-key joins or activating relationships between tables, read on to learn how AtScale avoids these problems. This three-part series will illustrate:
- How AtScale unlocks the path to a single source of truth in the face of constantly changing business demands.
- How Power-BI Analysts can meet their needs with Report-Scoped DAX expressions talking to AtScale Models.
- Do all of the above without sacrificing the benefits of multidimensional modeling.
How AtScale Enhances Data Model Reusability and Change Control
A central part of any Business Intelligence strategy is maintaining a single source of semantic and reporting truth for the business. This is an essential objective, but how can this be achieved without routing all the work through a single individual or team? Ideally, the solution allows different organizational groups to focus on their area of expertise in parallel and share their work with the broader enterprise. Finally, the technology needs to support a form of version control so that the changing needs of the business can be met without introducing uncontrolled breaking changes to shared assets.
Meeting these challenges with today’s Tabular Models is difficult because the tabular “bim” model format is a monolithic json file with embedded xml snippets. Storing the entire model in a single file makes it hard to reuse model components between enterprise groups. Additionally, the embedded xml snippets encode non-semantic details that change when humans unknowingly make trivial changes using GUI tools. Look at Figure 1 for an example of a monolithic bim file. Even though the bim file format is human-readable, the monolithic nature of the format makes it difficult to integrate changes from different teams, even when using source control.
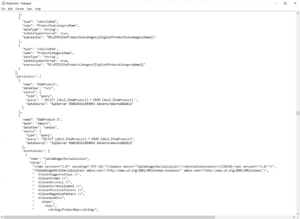
Figure 1. Example of a Monolithic “bim” File
By contrast, AtScale has an easy-to-read Yaml-based syntax called the “Semantic Modeling Language” (SML), which was designed from the ground up to support human readability, component reuse, and Git integration. Notably, the model can be separated into different files, making it easy to share model components between different centers of excellence (See Figure 2).
For example, one team can focus on defining the “Product” dimension while another can focus on developing the “Time” dimension. Both of these teams can share their work with the rest of the Enterprise and use standard SCM practices to control the release and uptake of these changes to avoid inflicting unexpected breaking changes on report authors in other groups.
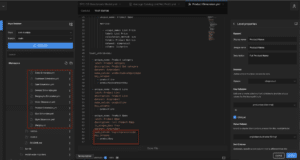
Figure 2. AtScale SML is human-readable, Git-friendly, and supports the decomposition of large models into a number of smaller model files
Solving Compound Key Relationship Issues with AtScale
What if you need to join two tables using more than one column? According to the Fabric support forum, Tabular models do not support such an ability without jumping through significant hoops. In Tabular models, your two options are: a) use Power Query to join the tables into a single table, or b) define a calculated column in each table to combine the multiple columns into a single composite column before defining a relationship. For someone accustomed to writing multi-column joins by hand, the level of effort of these workarounds is annoyingly high. Finally, these workarounds add undesired refresh and run-time overhead.
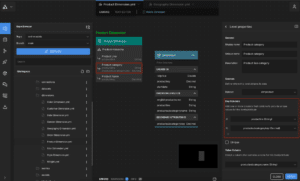
Figure 3. Compound Key Dimensional Attributes in AtScale
In AtScale, compound key dimensions and relationships are first-class citizens! Figure 3 illustrates the definition of compound-keyed attributes, specifically the “Product Category” level of the Product Dimension. Notice how the hierarchy level is defined by the “productline” and “productsubcategorykey” columns? To add another column, one simply clicks the “+” icon in the property panel’s Key Section.
To use a Compound-Key Level in a relationship, just drag one of the needed columns from the Fact table to the Dimension Level. Design Center’s Relationship panel allows you to associate the columns between the two tables. Figure 4 illustrates how the Order Dimension’s 3-column “Order Line Item” Level relates to the “factinternetsales” table.
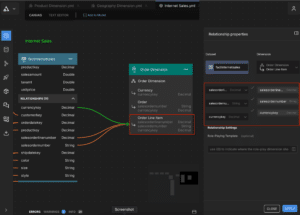
Figure 4. AtScale’s Support for Compound Key Relationships
Simplifying Multi-Table Dimensions with AtScale
One of the big advantages of Multi-Dimensional models is that they can sit on top of RDBMS star schemas and significantly simplify the presentation and accessibility of the data. Consider the example of a logical Geography Dimension that stores its data in separate physical tables: ZipCodes, State, and Country. Such a storage arrangement is common, but we don’t want report authors to worry about navigating these joins. We want to hide this complexity behind a single “Geography Dimension” that end-users can easily query and share between enterprise groups.
Since Tabular models don’t have a logical dimension concept, model architects are forced to denormalize their star schemas into a single tabular table before using it in a hierarchy definition. Figure 5 shows how the user must create a calculated column in a table and then enter a DAX expression that uses the RELATED() function to join in the column needed for the hierarchy from a related table. This solution assumes that the user already created a valid relationship between the tables in the model designer. Once all the columns needed from other tables have their corresponding calculated columns, one can start building the hierarchy. So many steps, Argh!

Figure 5. How Tabular Models Require Manual Creation of DAX Calculated Columns to Define Hierarchies that Span Multiple Tables
In AtScale, columns can be used from multiple tables without creating calculated columns or writing annoying “glue” code. Figure 6 illustrates how the State level is sourced from the dim_geo_state table and rolls up to the Level named “CountryCity”, sourced from the dim_geo_country table. The AtScale Dimension Canvas makes distributed hierarchies easy to build and understand.
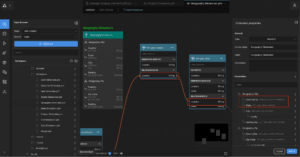
Figure 6. AtScale’s Built-In Support for Hierarchies that span multiple Tables
Leveraging Excel-Friendly Hierarchies with Direct Query
As illustrated in the previous example, you’ve worked so hard to define hierarchies that organize your reporting structure for your users. Wouldn’t it be nice if these hierarchies worked with Direct Query connections from Excel and Power BI? Unfortunately, Excel Direct Query connections just can’t see Tabular Hierarchies. If you have experience working with large datasets, you know that Direct Query connections are needed to analyze large datasets without blowing your budget on incredibly high-memory VM instances. Additionally, Direct Query connections are used to avoid SLA-busting refresh times and to keep data in place to satisfy strict corporate security policies. Fortunately, AtScale supports Direct Query connections to side-step all of these problems AND supports the same hierarchy experience for both Excel and Power BI users! Additionally, if you have Tableau, Looker or custom tools, all of these groups will experience your model hierarchies in the same way.
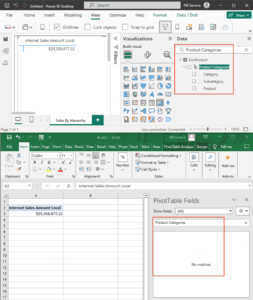
Figure 7. MSFT Tabular Hierarchies (top) are not accessible to Excel over Direct Query Connections (bottom)
Role-Playing Dimensions: A Better Approach with AtScale
What if your fact table has two important dates, the Order_Date and the Ship_Date? You’d like to create reports that use the full power of your Date Dimension to slice and filter on both of these dates by Year, Month, Day-of-Week, right? Of course you do, but you also don’t want to duplicate the definition of your Time dimension, one for “Order Date” and another dimension for “Ship Date”. The long-established solution to this problem involves the application of “Role-Playing Dimensions”. This Microsoft article does a pretty good job of explaining the use-case for Role-Playing dimensions and how Tabular Models “support” them. In short, Tabular models don’t really support role-playing dimensions, but instead introduce a “one-active-relationship” rule to solve the join-ambiguity problem experienced by the Tabular Engine at run-time. With this solution, the Model Architect needs to identify which relationship will be the most popular, and set that one to be the ‘active’ relationship. To create reports that require the other relationships, the report author must have intimate knowledge of the model so they can call the USERELATIONSHIP function to specify the join-path to the needed tables.
AtScale avoids run-time join-ambiguity by generating “Role-Played” Dimensions at Deployment Time. As a result, end-users navigate the model in an intuitive way and calculation-authors don’t need to write code to specify the right join-path. Returning to our “Order Date” and “Ship Date” example, Figures 8 and 9 show how the AtScale User draws a relationship from the desired Fact table columns to the Date Dimension and then assigns a “Role” to each relationship. This mechanism allows all relationships between two tables to be active all the time!
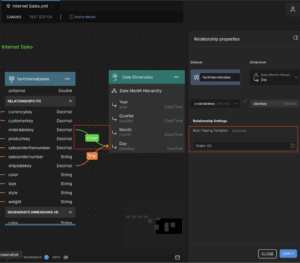
Figure 8. Reusing the Date Dimension by Role-Playing as “Order Date Dimension” via the Fact Table’s “orderdatekey” Column

Figure 9. Reusing the Date Dimension by Role-Playing as “Ship Date Dimension” via the Fact Table’s “shipdatekey” Column
After deployment, the End-User or Expression-Author will see two dimensions named “Ship Date Dimension” and “Order Date Dimension”. Users can group and filter by these two dimensions just like they would any other dimension. It should be noted that the Model Architect can change the rendering of the final Dimension by editing the “Role-Playing Template”. For example, if instead of “Ship Date Dimension” I want to render the dimension as “Date Dimension Shipped”, then I’d change the template to “{0} Shipped” (quotes excluded). The end result is a vastly simplified way of maximizing the reuse of Dimensions across your model and lowering the mental load on your Report Designers.
Conclusion
By adopting AtScale’s advanced features, you can overcome the limitations of tabular models and fully leverage modern data modeling techniques. Stay tuned for the next post in this series, where we’ll dive into how AtScale empowers Power BI Analysts with Report-Scoped DAX Expressions for dynamic, on-the-fly calculations. AtScale bridges these gaps by maintaining the high-value aspects of multi-dimensional models and modernizes the stack by introducing:
- Human-friendly SML to leverage component reusability.
- Git integration to support change-control best practices.
- Power BI DAX Report-Scoped Expressions.
- Consistent Reporting-Tool Experience across Power BI, Excel, Tableau, Looker, etc.
- A large number of supported back-end data warehouses.
Now that we’ve covered some of AtScale’s foundational features, I’ll cover AtScale’s support for Power BI Analysts who want to use Report-Scoped DAX Expressions to create calculations on the fly without changing the server-side model in the next two posts.
SHARE
Case Study: Vodafone Portugal Modernizes Data Analytics