Adam Conway (SVP of Product at Databricks) recently published a blog titled “Big Data Is Back and Is More Important Than AI” and argues that the most important revenue-generating or cost-saving workloads depend on massive data sets. This is especially true in the manufacturing industry, where data volumes are exploding and are expected to grow 200-500% in the next five years, outpacing other industries by 2-4x.
This explosion in data coincides with two industry trends changing how manufacturers view their most strategic asset—their data.
- Rising Costs and Supply Chain Disruption – The frequency of disruptive events is increasing by over 5x. This results in much shorter windows to respond with price, delivery, and supply chain actions. (COVID19 or Suez Canal anyone?)
- Shifting priority from Asset Efficiency to Customer Needs – Success metrics are shifting from Asset Efficiency (Uptime, Yield, Labor Productivity, Waste) to Customer Needs (Quality, On-time delivery, Production Flexibility)
Shiv Trisal (Global Manufacturing, Transportation & Energy GTM at Databricks) recently discussed the key challenges that Manufacturing CDOs face in gaining insight and competitive advantage from their data to help navigate these industry trends.
- No Single Source of Truth – Disjointed views of customers, operations, and assets caused by organizational data silos leads to data being stuck in close and proprietary systems.
- Lack of Real-Time Capabilities – Decision cycles are getting shorter, and batch-driven / siloed analytics prevent real-time insights and action.
- Hard to collaborate internally and externally – Inadequate and complex workflows make it difficult for suppliers and business partners to communicate.
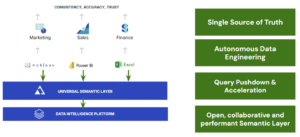
So, how can a Semantic Layer help?
One Consistent Compliant View of Business Metrics and Definitions
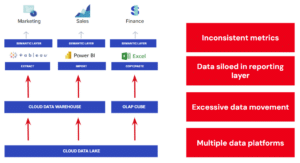
A major challenge for manufacturers is that the opaque supply chain consists of multiple teams, processes, and data silos. This drives the proliferation of competing and often incompatible platforms and tooling. Historically, manufacturing supply chains are made up of separate functions with different priorities. Over time, domain-specific business logic is built up in siloed tools, and Central IT often has to reinvent the wheel every time a new request comes from the business.
Ever been in a meeting where one person says the answer is 7, but the other says it’s 10, and the real answer turns out to be 20? The question being asked is the same, but the answer depends on what Excel sheet you are using or what data extract you are analyzing in PowerBI.
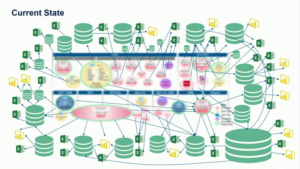
In a talk at DAIS on “Revolutionizing Data Analysis: The Shift to AtScale and Databricks”, Goeffery Roderick of Corning illustrated this scenario with a real-world example of how their analytical landscape has grown in complexity over 20 years. Shadow IT, Excel spreadsheets, and data extracts are a data governance nightmare and lead to analysts running the business with a limited view of the data.

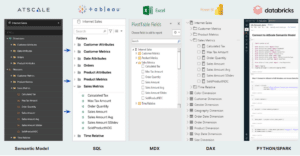
A Semantic Layer is designed to solve that exact problem. Domain experts across the supply chain can encode their business knowledge and logic into digital form for others to use – breaking down silos and creating a holistic view of manufacturing’s production and supply chain. AtScale simplifies data access and structure, allowing the central data team to define common models and definitions (i.e., business calendar, product hierarchy, organization structure) while the domain experts part of individual teams own and define their business process models (i.e., “shipping,” “billing,” “supplier”).
Composable Analytics Strategy that Supports Collaboration
Teams frequently work in isolation, leading to a huge duplication of efforts in analytics. Central IT teams need to juggle the dynamic needs of the business by maintaining a fragmented architecture that hinders their ability to make data actionable. Instead of waiting for IT to deliver data, business users create their own data extracts, models, and reports. As a result, competing data definitions and results destroyed management’s confidence and trust in analytics outputs.
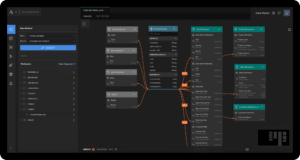
The AtScale Semantic Layer enables “composable analytics” — a repository of centrally governed building blocks for composing new data products. This standard library of assets needs to be created with both shareability and reusability in mind. Once this Semantic Model Repository is implemented, manufacturers can effectively shift to a hub-and-spoke model, where the semantic layer is the “hub,” and the “spokes” are the individual semantic models at each supply chain domain.
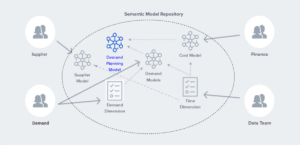
To create standard governance guardrails, centralized teams maintain fundamental building blocks, such as conformed dimensions (such as a time hierarchy) and basic views of analysis-ready data. But at the same time, domain teams are allowed to build and govern domain-specific elements of models, minimizing the amount of duplicative work and the risk of mistakes. And by taking a data mesh/ hub-and-spoke approach with composable analytics, your business analysts get to spend more of their time analyzing data, rather than waiting on data specialists to create a dimensional data model. With composable analytics, they can easily find the components to build a business ready view of the data, then start analyzing it right away with trust. Again, this shift is highlighted in Corning’s DAIS session.

Accelerate Data-Driven Decisions At Scale
A challenge that manufacturers face is the speed at which the business can surface new insights. In the fragmented architecture described earlier, there was an overdependence on IT to manually extract, transform and load data into a format that was ready to be analyzed by each supply chain domain. This approach often meant that actionable insights were slow to surface.
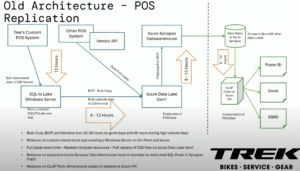
In a talk at DAIS, Advait Raje and Garret Batlzer of Trek Bikes discussed they challenges they faced replicating ERP and POS data to their Data Lake, with rising Data Warehouse costs and scaling their presentation layer to support ad-hoc analysis in PowerBI and Excel. Their legacy infrastructure required multiple hop, skips and jumps from Lake to Warehouse and then managing Multidimensional OLAP cube rebuild times. This process takes between 32-36 hours and if a business user requested new data it would take a full rebuild of the data supply chain.
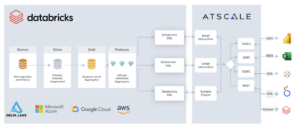
AtScale addresses this by autonomously defining, orchestrating, and materializing data structures based on the end user’s query patterns directly on Databricks.The entire lifecycle of these aggregates in the Delta Lake are managed by AtScale and are designed to improve the scale/performance of analytical workloads while also trying to anticipate future queries from BI users. This approach radically simplifies data pipelines while hardening against disruption caused by changes to underlying data or responding to external factors that change the end user’s query patterns. If you combine this Autonomous Data Engineering and Dynamic Query Pushdown it gives your business users access to data as it is made available in your Data Lake.
Conclusion
Establishing a universal semantic layer is more than a technical upgrade; it is a strategic investment in the future of an organization’s data infrastructure. By enhancing collaboration, building trust, and improving data accessibility, a universal semantic layer serves as the common data language for building data products across the supply chain.
SHARE
How Does Power BI / Direct Lake Perform & Scale on Microsoft Fabric